Dashboard
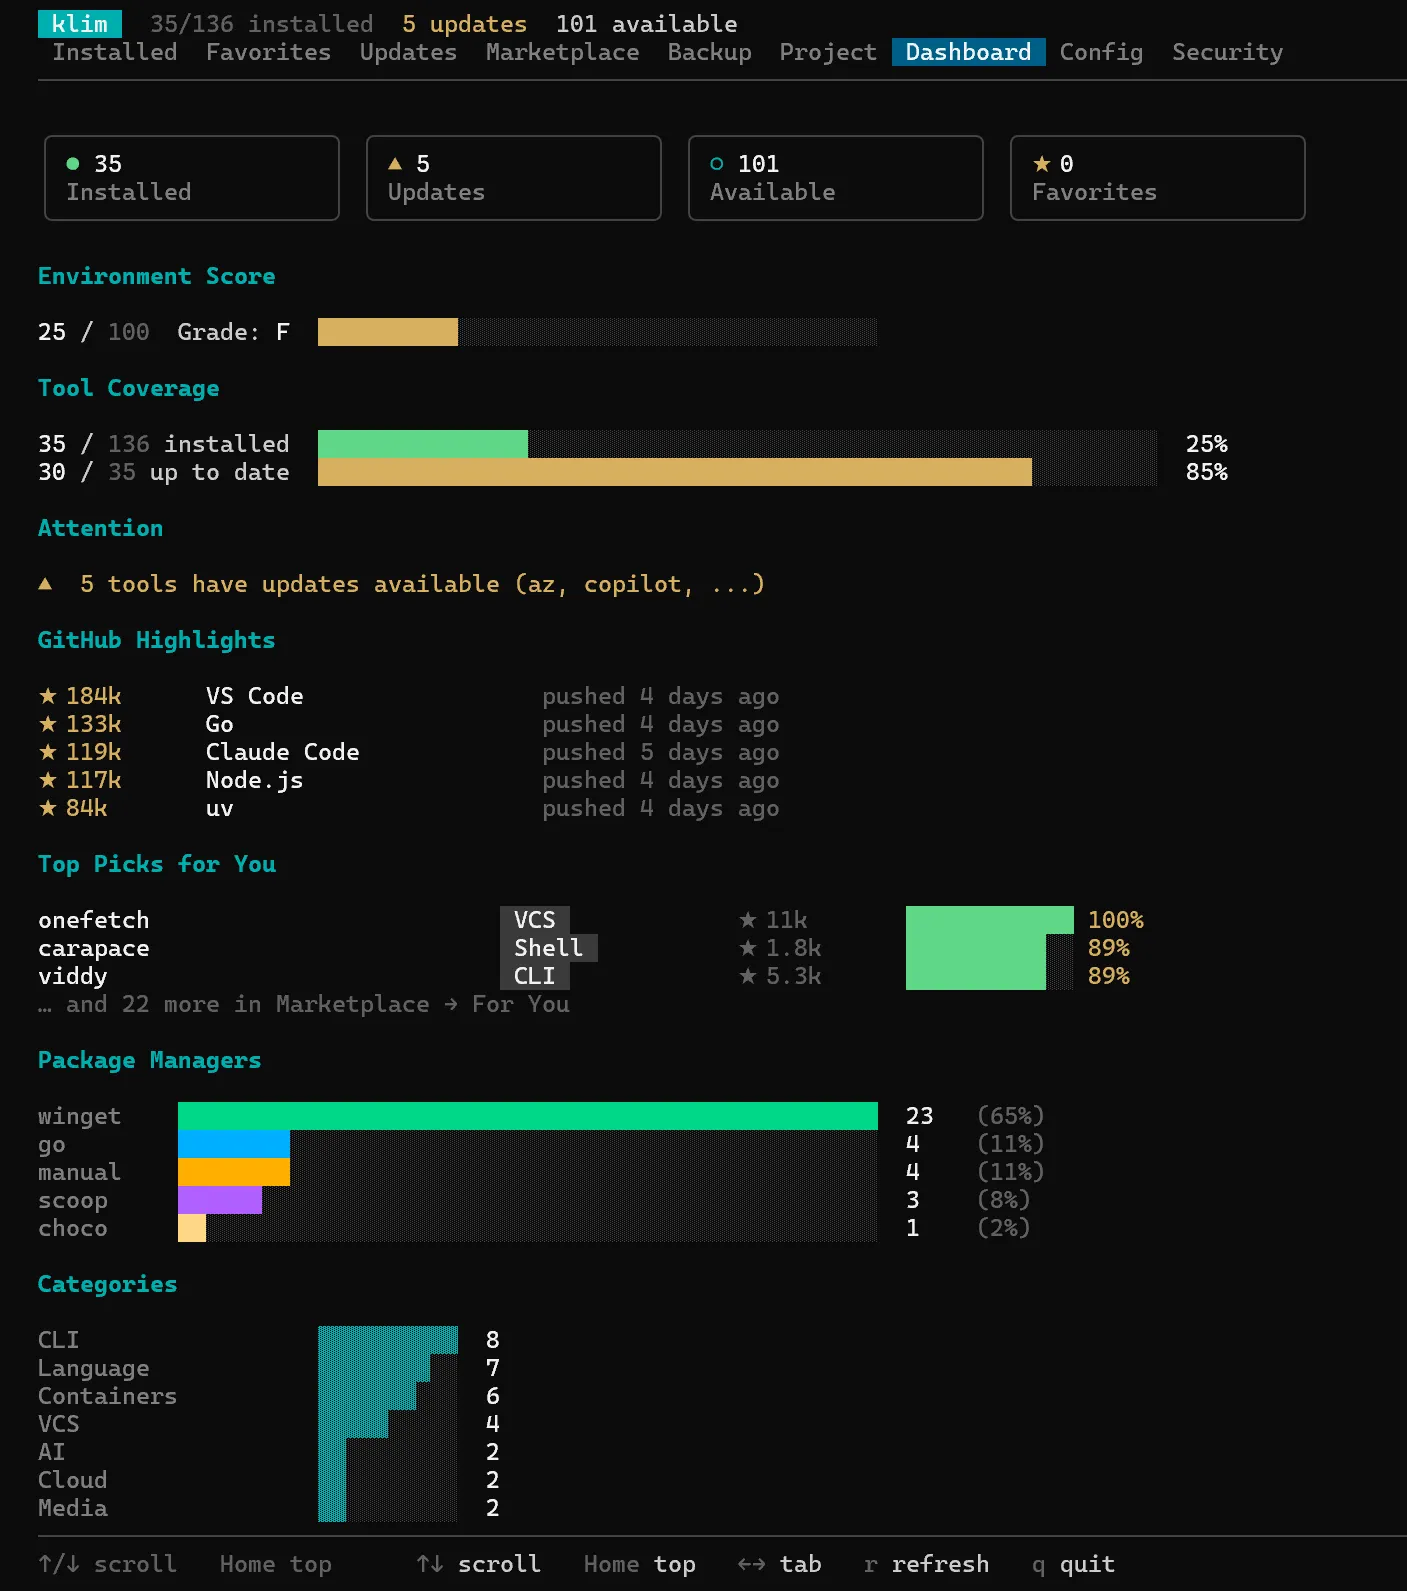
The Dashboard tab (press 7) provides a high-level overview of your developer tool ecosystem.
What It Shows
Section titled “What It Shows”Summary Gauges
Section titled “Summary Gauges”- Installed — Total number of detected tools
- Up to Date — Tools at the latest version
- Updates Available — Tools with newer versions
- Favorited — Number of favorited tools
Category Breakdown
Section titled “Category Breakdown”Distribution of your tools by category (Cloud, CLI, Containers, Database, IaC, Security, etc.) with counts and visual bars.
Platform Coverage
Section titled “Platform Coverage”How many tools are available on each platform (macOS, Linux, Windows) from the marketplace.
Tag Cloud
Section titled “Tag Cloud”Most common tags across your installed tools.
Install Source Distribution
Section titled “Install Source Distribution”Breakdown by package manager source — how many tools come from brew, winget, apt, scoop, npm, etc.
Keybindings
Section titled “Keybindings”| Key | Action |
|---|---|
↑ / ↓ | Scroll |
Home | Jump to top |
r | Refresh data |
When to Use
Section titled “When to Use”The Dashboard is useful for:
- Getting a quick snapshot of your development environment
- Identifying tools that need attention (updates available)
- Understanding your tool distribution across categories and sources
- Reporting on team tool standardization